TTEP.CN > 软件 >
Excel2013怎么给图表添加误差线?
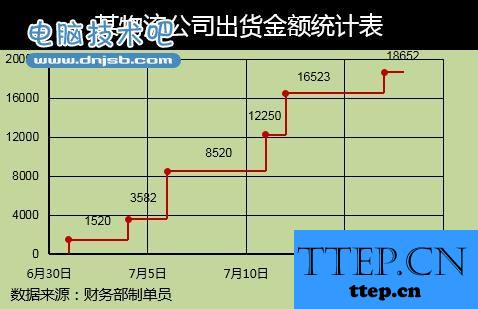
Excel2013怎么给图标添加误差线?很多数据需要详细的误差,我们怎么给图表添加误差线呢?下面分享Excel误差线的详细图文制作过程,需要的朋友可以参考下
你还在为Excel2013误差线怎么做而苦恼吗,今天小编教你Excel2013误差线怎么做,让你告别Excel2013误差线怎么做的烦恼。更多经验请关注Excel小新,如果帮到了你,请在上方给个投票谢谢支持。好人一生平安。
一、2013Excel误差线按钮
1、点击图表工具――设计――添加图表元素。

2、点击误差线――标准误差――百分比误差――标准偏差――其他误差线选项。
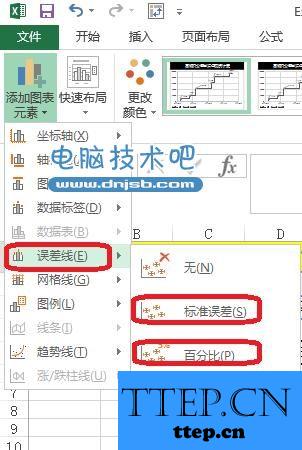
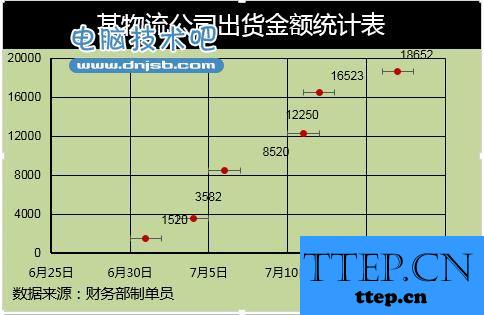
3、如图所示点击标准误差。分为X轴偏差――Y轴偏差。X轴偏差向右。
二、误差线设置
1、图表工具――格式――系列出货金额Y误差――设置所选内容格式。负偏差。

2、图表工具――格式――系列出货金额X误差――设置所选内容格式。正偏差。

3、点击设置误差线格式――通过自定义(指定值)来对误差进行设置。
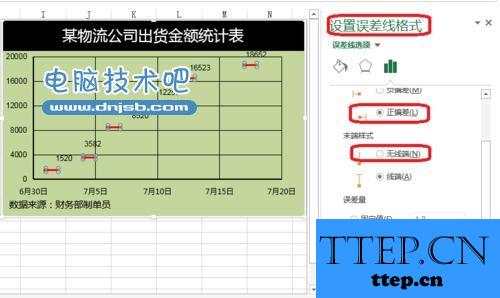
4、点击设置误差线格式――填充,对误差线的颜色等进行设置。

你还在为Excel2013误差线怎么做而苦恼吗,今天小编教你Excel2013误差线怎么做,让你告别Excel2013误差线怎么做的烦恼。更多经验请关注Excel小新,如果帮到了你,请在上方给个投票谢谢支持。好人一生平安。

一、2013Excel误差线按钮
1、点击图表工具――设计――添加图表元素。

2、点击误差线――标准误差――百分比误差――标准偏差――其他误差线选项。

3、如图所示点击标准误差。分为X轴偏差――Y轴偏差。X轴偏差向右。

二、误差线设置
1、图表工具――格式――系列出货金额Y误差――设置所选内容格式。负偏差。

2、图表工具――格式――系列出货金额X误差――设置所选内容格式。正偏差。

3、点击设置误差线格式――通过自定义(指定值)来对误差进行设置。

4、点击设置误差线格式――填充,对误差线的颜色等进行设置。

- 最近发表
- 赞助商链接