TTEP.CN > 软件 >
excel如何快速进行曲线拟合
在做社会调研或科学实验时常常需要把得到的实验数据拟合成曲线图,这样可以使结果形象易懂。下面将介绍怎么用excel来快速地进行曲线拟合。包括添加平滑曲线,线性,指数,幂,多项式(如二次曲线,三次曲线。。),对数拟合。
方法/步骤
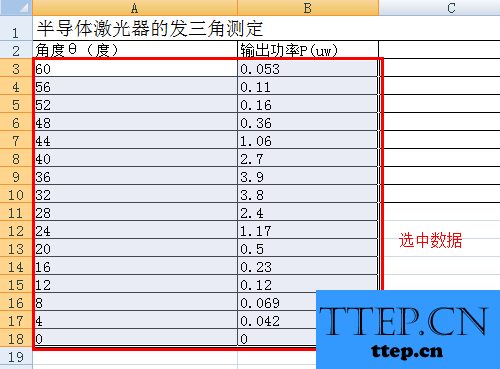
把实验数据输入excel中,两个变量的最好做成两个竖排。选中所有数据,注意不要把文字也选上了。
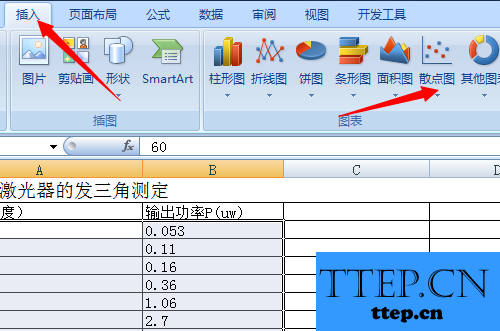
在菜单栏中点“插入”,然后选择“散点图”下面的下拉菜单。
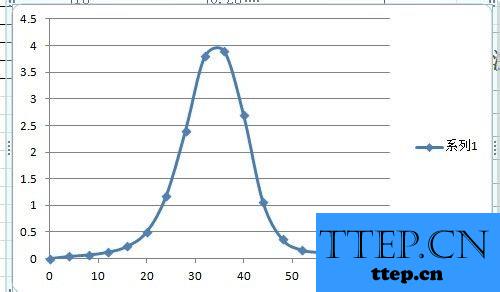
平滑曲线:
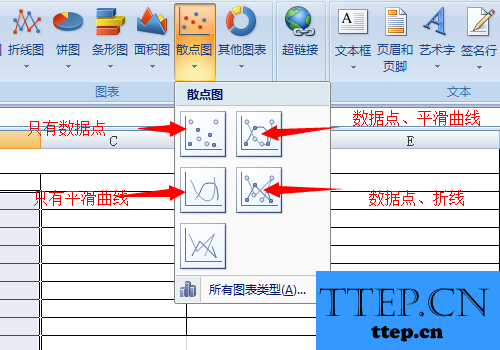
从菜单中选择自己需要的类型,一般选择既有数据点,又有平滑曲线的散点图。就能得到平滑曲线。
多项式拟合(线性,指数,幂,对数也类似):
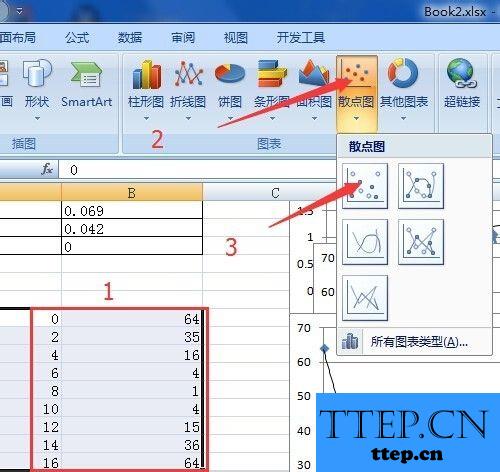
选取数据;
插入,散点图;
选择只有数据点的类型;
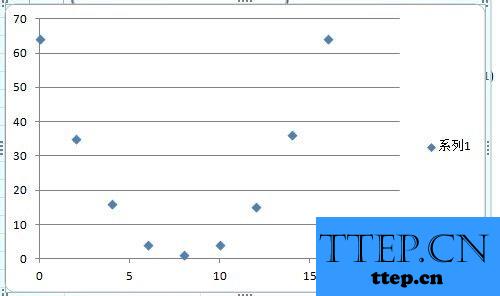
就能得到第二张图所示的数据点。
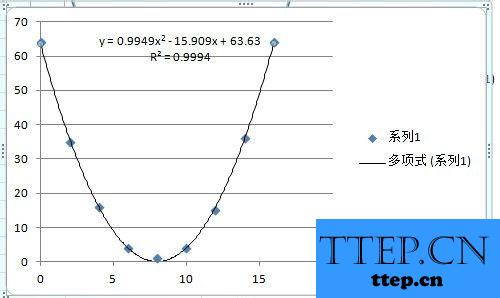
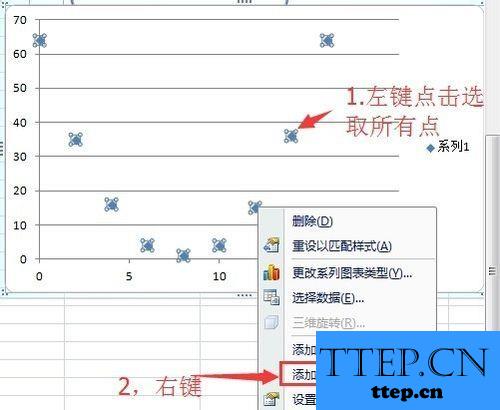
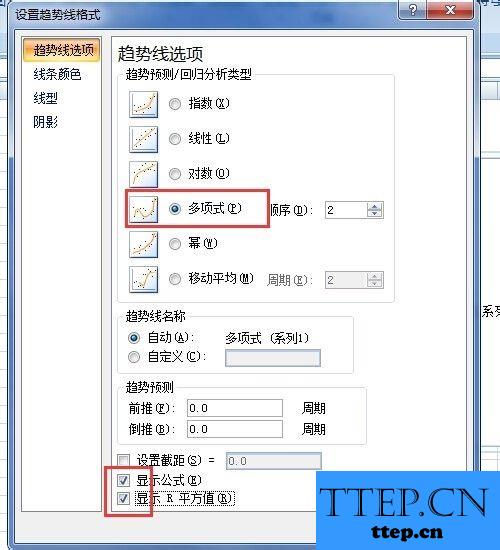
点击一个点,会选中所有数据点,然后点右键,在弹出的菜单中选择“添加趋势线”。
在这里可以选择需要你和的曲线类型,如线性,指数,幂,对数,多项式。。选择多项式。
再把下面的“显示公式”,“显示R平方”的复选框里打√,就能得到需要的曲线,公式,和相对误差。

图形格式设置:
生成图形后还有一些问题,比如没有坐标轴名称,没有刻度等。
打开菜单中的设计,点图标布局中的下拉菜单。
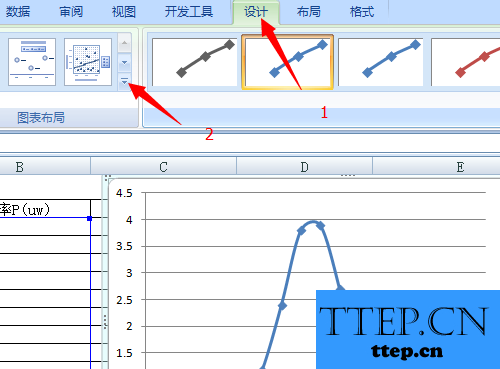
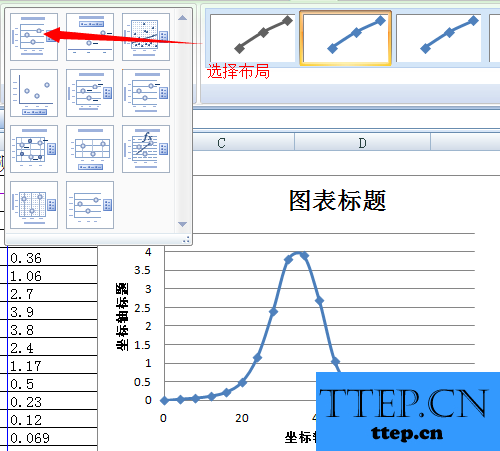
会看到有很多布局类型的图标,选择自己需要的。比如,图中选的布局是常见的有标题,坐标轴名称的。
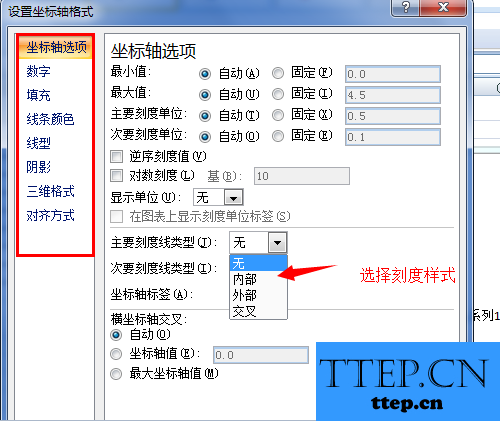
坐标轴还需要设置:用鼠标点击坐标轴附近的区域,右键,选择“设置坐标轴格式”。
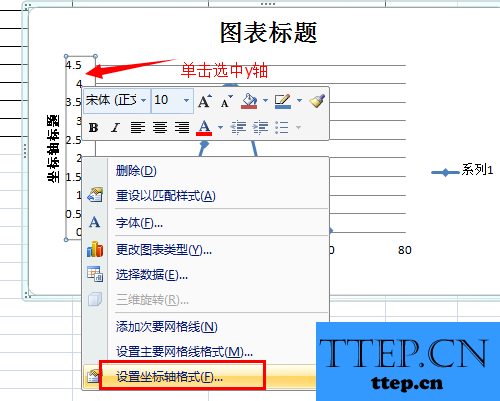
在这里可以进行详细地设置。具体操作根据自己需要进行。
以上是excel如何快速进行曲线拟合的全部内容,希望对大家有所帮助

方法/步骤
把实验数据输入excel中,两个变量的最好做成两个竖排。选中所有数据,注意不要把文字也选上了。

在菜单栏中点“插入”,然后选择“散点图”下面的下拉菜单。

平滑曲线:
从菜单中选择自己需要的类型,一般选择既有数据点,又有平滑曲线的散点图。就能得到平滑曲线。


多项式拟合(线性,指数,幂,对数也类似):
选取数据;
插入,散点图;
选择只有数据点的类型;
就能得到第二张图所示的数据点。


点击一个点,会选中所有数据点,然后点右键,在弹出的菜单中选择“添加趋势线”。

在这里可以选择需要你和的曲线类型,如线性,指数,幂,对数,多项式。。选择多项式。
再把下面的“显示公式”,“显示R平方”的复选框里打√,就能得到需要的曲线,公式,和相对误差。


图形格式设置:
生成图形后还有一些问题,比如没有坐标轴名称,没有刻度等。
打开菜单中的设计,点图标布局中的下拉菜单。

会看到有很多布局类型的图标,选择自己需要的。比如,图中选的布局是常见的有标题,坐标轴名称的。

坐标轴还需要设置:用鼠标点击坐标轴附近的区域,右键,选择“设置坐标轴格式”。

在这里可以进行详细地设置。具体操作根据自己需要进行。

以上是excel如何快速进行曲线拟合的全部内容,希望对大家有所帮助
- 最近发表
- 赞助商链接